If you’re like me (and you should be) you’ve seen lots of maps of the U.S. showing differences among the states in graphic fashion. Typically, they show the Southern States coming off as one might expect: worst. For instance, divorce rates are higher in the Bible Belt, as are rates of teen pregnancy. The disparity is pretty much a constant. On whatever measure, we in the sane states come off better.
So, does it come as a refreshing surprise, or a profound downer, that by one measure, we are almost universally stupid. It’s not surprising really, but when you see it in a graph it is downright depressing. Herewith, the highest paid “public servant” in each of the 50 states.
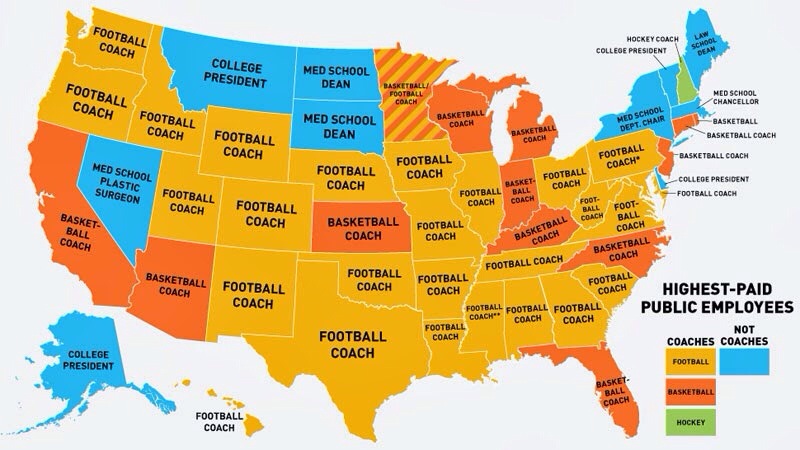
via Hullabaloo
Well, actually, New England comes off only half bad, though Connecticut should hang its head in shame.
Post a Comment